Summary
Table of Content

Weapon Mounts Market
Get a free sample of this report
Form submitted successfully!
Error submitting form. Please try again.
Thank you!
Your inquiry has been received. Our team will reach out to you with the required details via email. To ensure that you don't miss their response, kindly remember to check your spam folder as well!

Request Sectional Data
Thank you!
Your inquiry has been received. Our team will reach out to you with the required details via email. To ensure that you don't miss their response, kindly remember to check your spam folder as well!
Form submitted successfully!
Error submitting form. Please try again.
Weapon Mounts Market Size
Weapon Mounts Market size exceeded USD 1.87 billion in 2019 and will grow at 2.5% CAGR from 2020 to 2026. Rising military expenditure owing to unstable international security conditions will drive the industry expansion.
The global defense sector is expected to continue upward trajectory in the next few years due to political and security tensions. These unsettling situations will compel many countries to increase their defense expenditure. They will also help these countries to revitalize and modernize & solidify armaments portfolio. Rising military spending will create a plethora of opportunities for defense contractors, supply chain players that will fuel the market demand.

To get key market trends
In 2019, worldwide defense spending accounted for nearly USD 2 trillion, showcasing growth of about 3.5% over 2018. The majority of spending is contributed by five countries, including, the U.S., China, India, Russia, and Saudi Arabia. The procurement of weapons and military equipment is likely to bolster amid intensification of security threats, influencing the market growth trends.
Weapon Mounts Market Report Attributes
| Key Takeaway | Details |
|---|---|
| Market Size & Growth | |
| Base Year | 2019 |
| Market Size in 2019 | 1.86 Billion (USD) |
| Forecast Period 2020 to 2026 CAGR | 2.5% |
| Market Size in 2026 | 2.22 Billion (USD) |
| Key Market Trends | |
| Growth Drivers |
|
| Pitfalls & Challenges |
|
What are the growth opportunities in this market?
Continuous research & development activities and integration of cutting-edge technologies within the armaments sector will support the industry expansion. Technical experts and engineers work in collaboration with military organizations to understand basic need and modernize weapon systems accordingly. The advent of technology will aid in improving the operational capabilities of weapon mounts.
Moreover, it will prevent blocking of weapons, offer better stability, and improve targeting accuracy during combat situations. Furthermore, the product cost may increase by incorporation of technological elements, negatively influencing the weapon mounts industry growth.
Weapon Mounts Market Analysis
The non-static weapon mounts segment generated over USD 1 Billion in 2019. Various mounts, such as monopod, bipod, tripod, carriage, fork rest, etc., are included under this segment. The strong growth of monopods and bipods will be attributable to their compact size, lightweight, and portability. Monopods are generally used for short barrel and precision firearms. Bipods are suitable for sniper rifles and offer better accuracy with adjustable lengths.
Tripods provide excellent stability and used for heavy machine guns, anti-tank missile systems, grenade launchers, and recoilless rifles. However, tripods have the disadvantage of being bulky and heavyweight. Carriage mounts are used for weapons requiring special lifting arrangements. Increasing demand from the ground military sector will propel the growth of the non-static weapon mounts.

Learn more about the key segments shaping this market
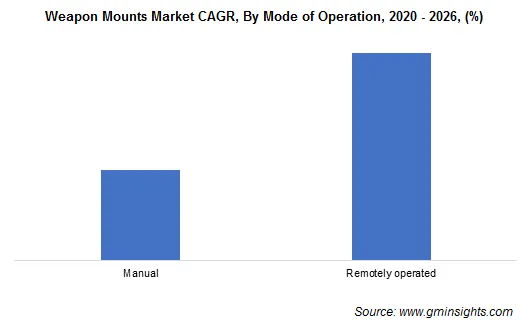
Remotely operated weapon mounts segment is projected to achieve over 2.5% CAGR during 2020-2026. These mounts are used in modernized weapon systems as they offer excellent protection to soldiers from enemy firepower. Remote weapon stations are widely becoming popular owing to their versatility, effective target engagement, and pinpoint accuracy. These systems can handle dynamic as well as static operations and used for ground stationary, ground mobile, and naval platforms on armored vehicles, patrol vehicles, sea vessels, etc.
Remotely operated systems are often equipped with auto tracking abilities to help the gunner for continuous monitoring of target and accurate shooting on-the-move. Additionally, these are integrated with computer-aided software systems, electro-optic sensors and related accessories including day camera, night camera, range finder, laser marker, beam spotlight, etc., that enhance the overall operational performance in adverse environmental and terrain conditions. Minimum operator risk and compatibility with a wide range of weapons and armored vehicles will trigger the rapid growth of this segment.
Land application segment dominated the industry with over 85% weapon mounts market share in 2019 and will continue its dominance till 2026 with territorial & border disputes, increasing terrorist activities, and geostrategic threats. These are influencing various countries to procure tanks, combat vehicles, armored personnel carriers, and armored infantry vehicles.
The procurements will generate the need for turrets and coaxial mounts. Evolving government policies and changing international relations will change the paradigm of the defense sector, which is likely to augment the weapon mounts sales for ground military in near future.

Learn more about the key segments shaping this market
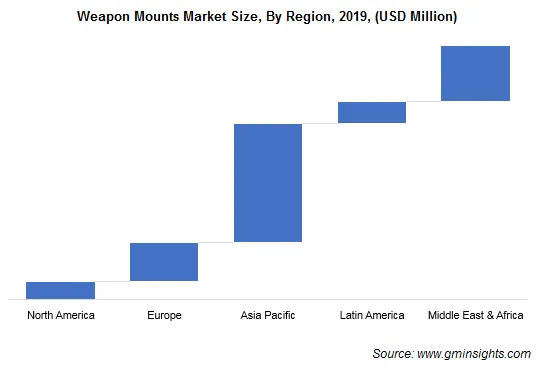
North America weapon mounts market share is poised to observe a growth rate of around 2.5% through 2026 propelled by high military spending, supportive government policies, and technological progressions. The U.S. accounted for nearly two-fifth of the global military spending in 2019. Rise in U.S. military spending in recent years was due to new arms procurement programs under Trump administration. Additionally, favorable trends associated with the U.S. airborne military sector will support the product demand.
The aircraft fleet strength of the U.S. accounts for approximately one-fourth of the global aircraft fleet strength. It has an extensive range of modern fighter aircraft, special mission aircraft, helicopters, etc. Product manufacturers formed alliances with the U.S. military, which will support the weapon mounts business expansion.
Weapon Mounts Market Share
The key weapon mounts market participants include :
- FN Herstal
- Leonardo S.p.A
- Moog Inc
- Otoker
- Rheinmetall AG
- Rafael Advanced Defense Systems
- Electro Optic Systems
- Elbit Systems
- BAE Systems
These players are adopting various strategies, such as partnerships & collaborations, mergers & acquisitions, product differentiation & development, etc., in search of additional bottom lines.itional bottom lines.
This market research report on weapon mounts includes in-depth coverage of the industry with estimates & forecast in terms of revenue in USD million from 2016 to 2026, for the following segments:
Market, By Type
Static
- Non-static
Market, By Mode of Operation
Manual
- Remotely operated
Market, By Application
Land
- Sea
- Air
The above information is provided on a regional and country basis for the following:
- North America
- U.S.
- Canada
- Europe
- Germany
- UK
- France
- Italy
- Russia
- Asia Pacific
- China
- India
- Japan
- Indonesia
- South Korea
- LATAM
- Brazil
- Mexico
- MEA
- Saudi Arabia
- Egypt
- Turkey
- South Africa
Frequently Asked Question(FAQ) :
How will the global weapon mount market fare across North America?
The weapon mounts market share in North America is expected to witness a growth of about 2.5% CAGR through 2026.
What will drive the growth of the global weapon mounts market size through 2026?
The market size of weapon mounts surpassed USD 1.87 billion in 2019 and is expected to grow at a CAGR of 2.5% through 2026. The increasing military expenditure due to unstable international security conditions will drive the industry growth.
What factors will drive the growth of remotely operated mounts?
Remotely operated weapon mounts are projected to witness a CAGR of over 2.5% through 2026. Their compatibility with a broad range of weapons and armored vehicles and minimum operator risk will propel the segment
Which type segment is likely to dominate the global weapon mounts market?
The non-static weapon mounts segment generated more than USD 1 Billion in 2019 and is expected to witness substantial growth in the coming years.
Weapon Mounts Market Scope
Related Reports


