Home > Chemicals & Materials > Advanced Materials > Functional Materials > Refractories Market
Refractories Market Size
- Report ID: GMI3663
- Published Date: Jun 2019
- Report Format: PDF
Refractories Market Size
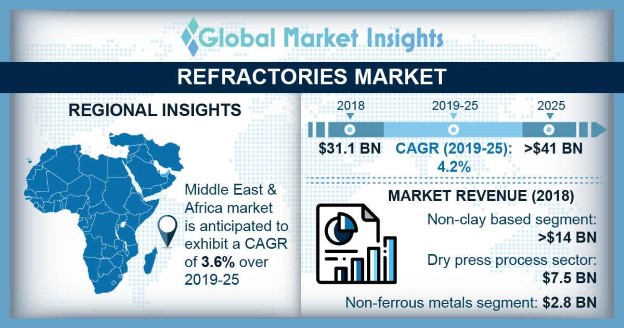
Refractories Market Size was over USD 30 Billion in 2018 and will witness a CAGR of more than 4% between 2019 and 2025.
Strong product demand from aerospace, electrical, automotive, glass, cement industries is expected to drive refractories market size globally. It can withstand extreme temperature which is required for modern manufacturing. Being heat-resistant than most of the other metals, they are used for lining hot surfaces found inside many industrial processes. Refractories is available in different shapes and sizes; they are generally pressed, molded or produced in interlocking shapes and wedges for its use in floors and walls.
Growing iron and steel industry will have a positive outlook on the market for projected period of time. For instance, the global steel production was 1,433 million tons in 2010 and increased to 1,808 million tons by 2018. The rapid growth of iron and steel industry can be attributed to growing infrastructural projects mainly in emerging economies of Asia Pacific. Moreover, with rising demand for more energy efficient technique in steel making the demand for refractories is estimated to grow in the near future. Emission of volatile organic compounds (VOCs) and its environmental concerns along with health and safety issues related with refractories is likely to hinder the overall refractories market share in forecast time period. However, increasing efficiency of baghouses and fabric filters to control VOC emissions, will have a positive outlook for the market size by 2025.
| Report Attribute | Details |
|---|---|
| Base Year: | 2018 |
| Refractories Market Size in 2018: | 30 Billion (USD) |
| Forecast Period: | 2019 to 2025 |
| Forecast Period 2019 to 2025 CAGR: | 4% |
| 2025 Value Projection: | 41 Billion (USD) |
| Historical Data for: | 2014 to 2018 |
| No. of Pages: | 364 |
| Tables, Charts & Figures: | 539 |
| Segments covered: | Form, Composition, Type, Manufacturing Process, End-user and Region |
| Growth Drivers: |
|
| Pitfalls & Challenges: |
|

