Home > Chemicals & Materials > Advanced Materials > Functional Materials > Photoresist And Photoresist Ancillaries Market
Photoresist And Photoresist Ancillaries Market Size
- Report ID: GMI1581
- Published Date: May 2017
- Report Format: PDF
Photoresist And Photoresist Ancillaries Market Size
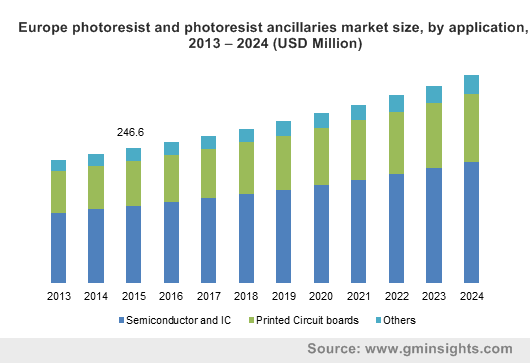
Photoresist And Photoresist Ancillaries Market size was valued at more than USD 3.5 billion in 2016 and is expected to grow with a CAGR of over 6.5%. /p>

Growth observed in semiconductor industry and developments in display technology will drive the photoresist and photoresist ancillaries market during the forecast years. They are used in high density packaging and wiring configuration in multi-layered semiconductor manufacturing, which are indispensable parts of laptops, computers, servers, and phones. They are also used in consumer electronic products such as music players, household appliances, etc. and employed in other industrial activities. Global semiconductors industry size stood at more than USD 300 billion in 2016. Due to improving economic condition in developing countries and increase in disposable income of people, demand for electronic gadgets and appliances are on the rise. This will increase the semiconductors demand, which in turn will propel the growth of the industry in the coming years./p>
The photoresist and photoresist ancillaries market products are mainly solvent-based solutions which include electronic-grade solvents, polymer resins, stabilizers, surfactants, photosensitive chemicals, and cross-linking agents. These solvents release volatile organic compounds which are carcinogenic in nature, reacts with sunlight to form air pollutants and are hazardous to human health and environment. Various environment and health regulatory agencies like Environmental Protection Agency (EPA) and Registration, Evaluation, Authorization and Restriction of Chemicals (REACH) have imposed strict rules and regulations regarding storage, transport and use of these solvents. This may hamper the global photoresist and photoresist ancillaries market in the future years./p>
| Report Attribute | Details |
|---|---|
| Base Year: | 2016 |
| Photoresist and Photoresist Ancillaries Market Size in 2016: | 3.5 Billion (USD) |
| Forecast Period: | 2017 to 2024 |
| Forecast Period 2017 to 2024 CAGR: | 6.5% |
| 2024 Value Projection: | 6 Billion (USD) |
| Historical Data for: | 2013 to 2016 |
| No. of Pages: | 100 |
| Tables, Charts & Figures: | 127 |
| Segments covered: | Product and Region |
| Growth Drivers: |
|
| Pitfalls & Challenges: |
|
