Home > Automotive > Automotive Logistics > Freight Logistics > Europe Inland Waterways Vessel Market
Europe Inland Waterways Vessel Market Size
- Report ID: GMI2304
- Published Date: Dec 2017
- Report Format: PDF
Europe Inland Waterways Vessel Market Size
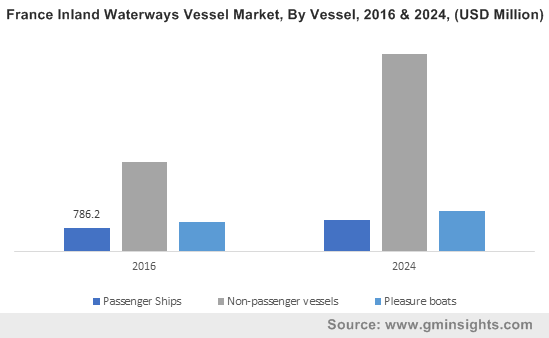
Europe Inland Waterways Vessel Market size was worth over USD 55.85 billion in 2016 and is estimated to reach USD 115 billion by 2024 at over 9% CAGR from 2017 to 2024.

Increasing marine passenger traffic and goods transportation will drive the Europe inland waterways vessel market share during the forecast period. EU constantly working on improving legislation to adopt a uniform set of technical standards for inland navigations vessels which in turn support the industry growth. In June 2016, European Council formally adopted revised directive to set the technical requirements for inland waterways vessels operations. The Central Commission for Navigation of Rhine (CCNR) in partnership with European Commission develop and monitor regulations for waterway transportation. The organization is engaged in various activities related to transport on rhine such as developing regulations ensuring the river environment, provides information services to support traffic & transport management in inland navigation.
Increasing consumer preference for pleasure boats will support the industry growth during the forecast period. Boating industry is competitive and significant contributor to the regional growth. Europe recreational marine activities is stimulated by 27,000 km of inland waterways and more than 70,000 km of coastline and from international tourists. Recovering economies in the region and increasing travel & tourism across the globe is expected to increase the demand for Europe inland waterways vessel market share. However, cost associated with upgrading the existing fleet, new vessel construction and uncertain economic condition in the region will hamper the industry growth during the forecast period.
| Report Attribute | Details |
|---|---|
| Base Year: | 2016 |
| Europe Inland Waterways Vessel Market Size in 2016: | 55.85 Billion (USD) |
| Forecast Period: | 2017 to 2024 |
| Forecast Period 2017 to 2024 CAGR: | 9% |
| 2024 Value Projection: | 115 Billion (USD) |
| Historical Data for: | 2013 to 2016 |
| No. of Pages: | 285 |
| Tables, Charts & Figures: | 143 |
| Segments covered: | Vessel, Fuel and Region |
| Growth Drivers: |
|
| Pitfalls & Challenges: |
|
